West LA & Beach Cities Apartment Building Sales
Explore 63 closed transactions totaling $215.01M in the West LA & Beach Cities market. Data from the LAAA Team at Marcus & Millichap.
Request Free Valuation63
Transactions
$215.01M
Total Volume
3.69%
Avg Cap Rate
$529,200
Avg $/Unit
7
Avg Units
2012
Since
Cap rate, price per unit and unit count are averaged across apartment sales only: 35 of these 63 closed transactions are apartment sales. A sale with no figure recorded is left out of that average, so cap rate draws on 32.
LAAA Team Track Record Since 2012
West LA & Beach Cities Multifamily Market Overview
West Los Angeles and the Beach Cities represent the highest-value multifamily market in the Los Angeles basin, where proximity to the Pacific Ocean, Silicon Beach employment corridors, and UCLA drives premium pricing. Across 63 closed transactions totaling $215M in sales volume, the LAAA Team has documented an average price per unit of $529,000 across its 35 apartment sales, reflecting the intense demand for rental housing in these supply-constrained neighborhoods.
Santa Monica dominates the submarket with 21 deals and $79.8M in volume. Properties along Ocean Avenue, Montana Avenue, and the blocks between Wilshire Boulevard and Santa Monica Boulevard command the highest per-unit pricing in the region. Santa Monica operates under its own rent control ordinance, administered by the Santa Monica Rent Control Board, which is among the most restrictive in California and applies to buildings with 2+ units built before April 10, 1979. This regulatory environment creates significant embedded value in below-market rents, making vacancy decontrol and renovation the primary value-add strategy.
The West LA corridor along Sawtelle Boulevard, Sepulveda Boulevard, and surrounding blocks near the 405 freeway provides more accessible entry points, with 10 transactions averaging $674,000 per unit. This area benefits from proximity to the Expo Line stations, UCLA, and the growing tech employment base centered around Playa Vista and Culver City.
Westwood and Brentwood, adjacent to UCLA and the San Diego Freeway, cater to graduate students, young professionals, and faculty, supporting consistent occupancy rates above 97%. The Venice and Mar Vista markets along Abbot Kinney Boulevard, Lincoln Boulevard, and Washington Boulevard have seen significant rent growth driven by the creative economy and proximity to the beach.
Cap rates in West LA average 3.69% across the submarket's apartment sales, ranging from 1.83% to 5.27%. The lower end reflects trophy assets in Santa Monica and Brentwood, while the higher end captures value-add opportunities in Palms and Mar Vista. Building stock ranges from pre-war courtyard apartments along tree-lined streets to 1960s mid-century buildings and newer transit-oriented developments near Expo Line stations.
Market Snapshot
Source: CoStar | West La Multifamily | 2026 Q1Rents by Unit Type
Investment Activity (Trailing 12 Mo)
City Breakdown
Santa Monica
21$79.79M volume
Avg cap: 3.92%
Avg $/unit: $517,818
View City →
West LA
10$34.91M volume
Avg cap: 3.28%
Avg $/unit: $720,107
View City →
Westwood
6$28.90M volume
Avg cap: 3.45%
Avg $/unit: $587,500
View City →
Beverlywood
5$18.02M volume
Avg cap: 2.83%
Avg $/unit: $482,000
View City →
Venice
5$10.63M volume
Avg cap: 3.73%
Avg $/unit: $719,633
View City →
Palms
4$5.39M volume
Avg cap: 3.03%
Avg $/unit: $318,500
View City →
West Hollywood
3$6M volume
Avg cap: 3.13%
Avg $/unit: $500,000
Mar Vista
2$4.66M volume
Avg cap: 4.25%
Avg $/unit: $352,000
Manhattan Beach
2$8M volume
Avg cap: 4.37%
Avg $/unit: $575,000
Playa Del Rey
1$4.38M volume
Avg $/unit: $312,857
Long Beach
1$4.90M volume
Brentwood
1$3.20M volume
Rancho Park
1$2.90M volume
Beverly Hills
1$3.33M volume
Avg cap: 2.77%
Avg $/unit: $475,000
West LA & Beach Cities Market Area
LAAA Team Closings in West LA & Beach Cities
63 transactions totaling $215.01M by Glen Scher, Filip Niculete & the LAAA Team
7749 St Bernard St
Playa Del Rey • 2025
$4,380,000Units
14$/Unit
$312,857
1617 Barry Ave
Los Angeles • 2025
$2,690,000
3205 Ocean Park Blvd
Santa Monica • 2025
$7,000,000Units
6$/Unit
$1,166,667
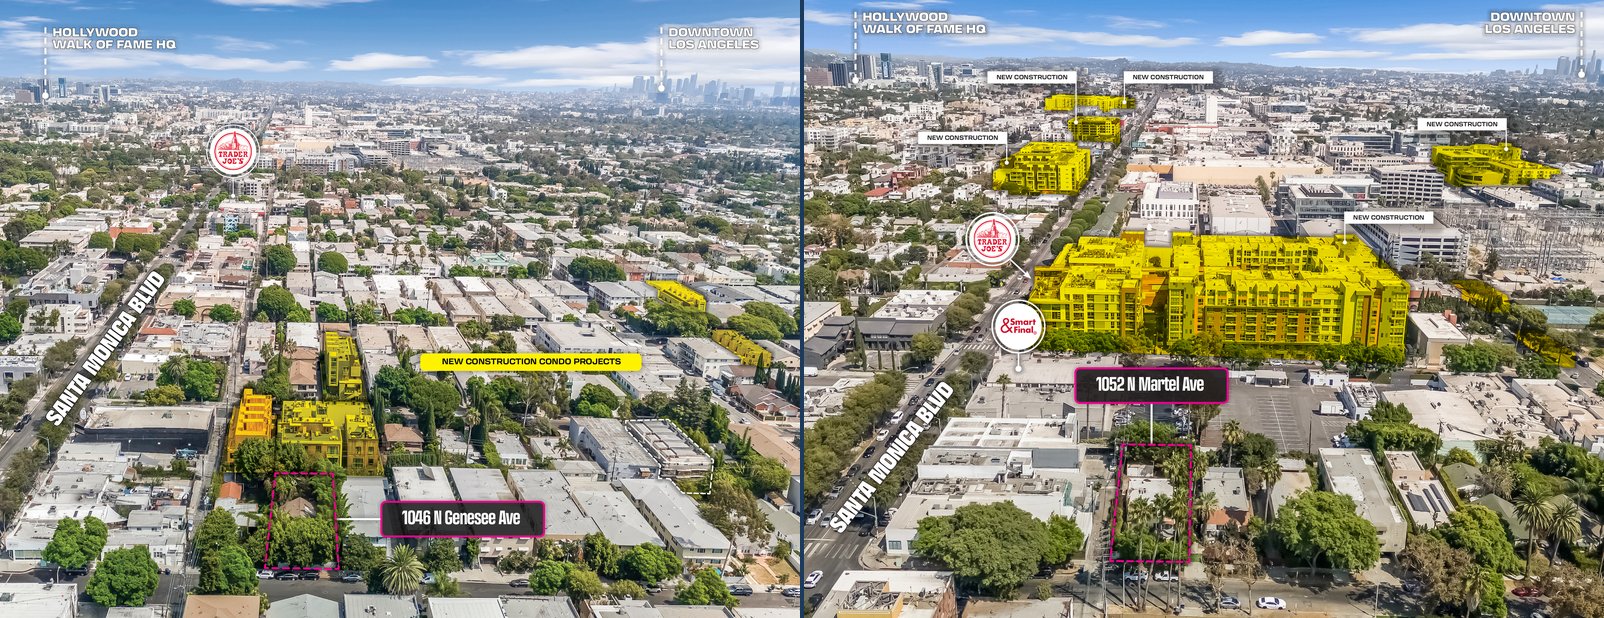
1052 N Martel Ave
West Hollywood • 2025
$1,640,000
1046 N Genesee Ave
West Hollywood • 2025
$1,860,000
1233 S Bedford St
Los Angeles • 2024
$2,100,000
657 Flower Ave
Venice • 2024
$1,175,000
4211 McLaughlin Ave
Los Angeles • 2023
$1,760,000Units
5Cap
4.25%$/Unit
$352,000
12202 Exposition Blvd
Los Angeles • 2023
$2,256,000
300 Alamitos Ave
Long Beach • 2023
$4,900,000
504 Glenrock Ave & 505 Landfair Ave
Los Angeles • 2023
$12,750,000
1826 12th St
Manhattan Beach • 2023
$4,500,000Units
10Cap
4.37%$/Unit
$450,000
1528 10th St
Santa Monica • 2022
$3,350,000Units
8Cap
4.20%$/Unit
$418,750
1531 Sawtelle Blvd
Los Angeles • 2022
$2,950,000
10605 Eastborne Ave
Los Angeles • 2022
$2,400,000
2339 Abbot Kinney Blvd
Venice • 2022
$1,817,800Units
3Cap
3.35%$/Unit
$605,933
1541 S Hayworth Ave
Los Angeles • 2022
$2,150,000
1540 7th St
Santa Monica • 2022
$6,050,000Units
8Cap
3.87%$/Unit
$756,250
1463-1467 Wellesley Ave
Los Angeles • 2022
$3,210,000
1209 6th Ave
Venice • 2021
$910,000
Source: LAAA Team Closed Transactions
Recent Deal Stories


Our Active Listings in West LA & Beach Cities
West LA & Beach Cities Multifamily Investment FAQs
Also Explore
What's Your West LA & Beach Cities Apartment Building Worth?
Get a complimentary Broker Opinion of Value from the LAAA Team.