Ventura & Santa Barbara Apartment Building Sales
Explore 17 closed transactions totaling $50.17M in the Ventura & Santa Barbara market. Data from the LAAA Team at Marcus & Millichap.
Request Free Valuation17
Transactions
$50.17M
Total Volume
4.79%
Avg Cap Rate
$295,672
Avg $/Unit
11
Avg Units
2012
Since
Cap rate, price per unit and unit count are averaged across apartment sales only: 15 of these 17 closed transactions are apartment sales.
LAAA Team Track Record Since 2012
Ventura & Santa Barbara Multifamily Market Overview
The Ventura and Santa Barbara counties represent a distinct suburban and coastal multifamily market north of Los Angeles along the Highway 101 corridor, offering more affordable entry points than most LA proper submarkets. Across 17 closed transactions totaling $50.2M in volume, the LAAA Team has documented an average cap rate of 4.79% and an average price per unit of $296,000 across the submarket's apartment sales, positioning this submarket as a favored destination for 1031 exchange buyers exiting more expensive LA markets.
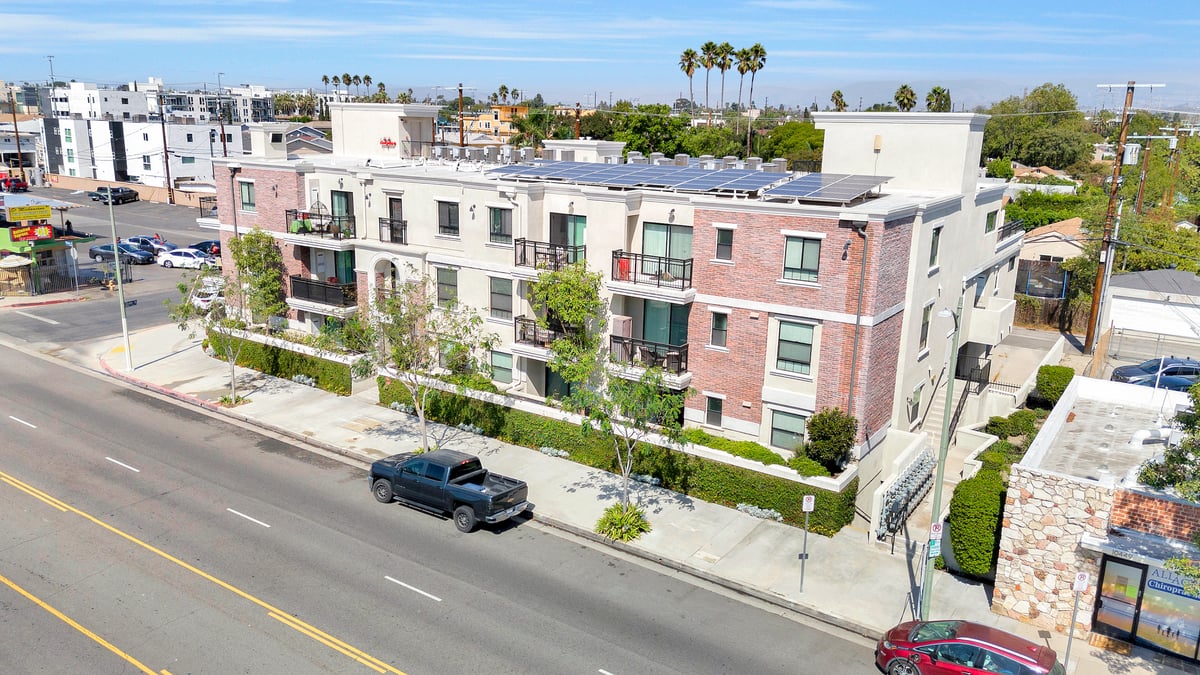
Oxnard leads the submarket with 6 closed transactions, anchored by a diverse economy of agriculture, military (Naval Base Ventura County), and growing healthcare and logistics sectors. The city's apartment stock along Saviers Road, Channel Islands Boulevard, and Oxnard Boulevard provides workforce housing at price points well below comparable LA assets. Ventura's downtown along Main Street and the neighborhoods near Ventura Harbor offer a coastal lifestyle that attracts tenants seeking beach proximity without Santa Barbara pricing.
The Highway 101 corridor cities of Thousand Oaks, Camarillo, Simi Valley, and Moorpark provide suburban apartment investments with strong school districts and low crime rates that support premium rents relative to the submarket average. These communities attract families and professionals commuting to both the San Fernando Valley and the broader LA employment base, creating stable occupancy and predictable cash flow.
Santa Barbara and Goleta, anchored by UC Santa Barbara (26,000 students), provide a distinct investment niche with extremely low vacancy driven by university demand, coastal barriers to new supply, and one of California's most desirable lifestyle markets. None of these cities fall under the Los Angeles city rent control ordinance; each operates under its own regulatory framework or AB 1482 statewide protections. The submarket's appeal to investors centers on stronger current cash flow compared to LA, combined with the quality-of-life attributes that sustain long-term rental demand along the Central Coast.
Market Snapshot
Source: CoStar | Ventura Santa Barbara Multifamily | 2026 Q1Rents by Unit Type
Investment Activity (Trailing 12 Mo)
City Breakdown
Oxnard
6$12.85M volume
Avg cap: 4.37%
Avg $/unit: $256,364
View City →
Thousand Oaks
2$2.30M volume
Avg cap: 5.70%
Avg $/unit: $372,000
Santa Barbara
2$4.91M volume
Avg cap: 4.91%
Avg $/unit: $306,563
Ojai
1$8.25M volume
Avg cap: 5.63%
Avg $/unit: $257,813
Ventura
1$2.49M volume
Avg cap: 5.02%
Avg $/unit: $310,875
Fillmore
1$845,000 volume
Avg cap: 5.28%
Avg $/unit: $281,667
Goleta
1$4.45M volume
Avg cap: 4.50%
Avg $/unit: $635,292
Camarillo
1$8.07M volume
Avg cap: 4.55%
Avg $/unit: $244,697
Santa Paula
1$1.27M volume
Avg cap: 5.06%
Avg $/unit: $181,429
Agoura Hills
1$4.75M volume
Ventura & Santa Barbara Market Area
LAAA Team Closings in Ventura & Santa Barbara
17 transactions totaling $50.17M by Glen Scher, Filip Niculete & the LAAA Team
514-516 E Oak St & 601 Grand Ave
Ojai • 2025
$8,250,000Units
32Cap
5.63%$/Unit
$257,813
1200 N H St
Oxnard • 2025
$4,647,332Units
18Cap
5.47%$/Unit
$258,185
40 N Brent St
Ventura • 2024
$2,487,000Units
8Cap
5.02%$/Unit
$310,875
255 Sespe Ave
Fillmore • 2023
$845,000Units
3Cap
5.28%$/Unit
$281,667
3305 S A St
Oxnard • 2021
$1,250,000Units
4Cap
4.31%$/Unit
$312,500
1200 N H St
Oxnard • 2021
$4,350,000Units
18Cap
4.73%$/Unit
$241,667
332 Cahuenga Dr
Oxnard • 2021
$785,000Units
2Cap
2.98%$/Unit
$392,500
2661 Los Robles Rd
Thousand Oaks • 2021
$1,116,000Units
3Cap
5.70%$/Unit
$372,000
6839 Sabado Tarde Rd
Goleta • 2021
$4,447,047Units
7Cap
4.50%$/Unit
$635,292
318 S Voluntario St
Santa Barbara • 2021
$2,610,000Units
8Cap
4.84%$/Unit
$326,250
1816-1818 Los Feliz Dr
Thousand Oaks • 2020
$1,180,000
520 Daily Drive
Camarillo • 2020
$8,075,000Units
33Cap
4.55%$/Unit
$244,697
627 E Virginia Terrace
Santa Paula • 2020
$1,270,000Units
7Cap
5.06%$/Unit
$181,429
318 S Voluntario St
Santa Barbara • 2019
$2,295,000Units
8Cap
4.98%$/Unit
$286,875
28348 Roadside Dr
Agoura Hills • 2019
$4,750,000Cap
1.95%
905 North A Street
Oxnard • 2016
$890,000Units
6Cap
4.18%$/Unit
$148,333
531 West Channel Islands Boulevard
Oxnard • 2015
$925,000Units
5Cap
4.54%$/Unit
$185,000
Source: LAAA Team Closed Transactions
Recent Deal Stories


Our Active Listings in Ventura & Santa Barbara
Ventura & Santa Barbara Multifamily Investment FAQs
Also Explore
What's Your Ventura & Santa Barbara Apartment Building Worth?
Get a complimentary Broker Opinion of Value from the LAAA Team.