Hollywood & Eastside Apartment Building Sales
Explore 20 closed transactions totaling $48.27M in the Hollywood & Eastside market. Data from the LAAA Team at Marcus & Millichap.
Request Free Valuation20
Transactions
$48.27M
Total Volume
4.58%
Avg Cap Rate
$393,375
Avg $/Unit
8
Avg Units
2012
Since
Cap rate, price per unit and unit count are averaged across apartment sales only: 13 of these 20 closed transactions are apartment sales. A sale with no figure recorded is left out of that average, so cap rate draws on 11.
LAAA Team Track Record Since 2012
Hollywood & Eastside Multifamily Market Overview
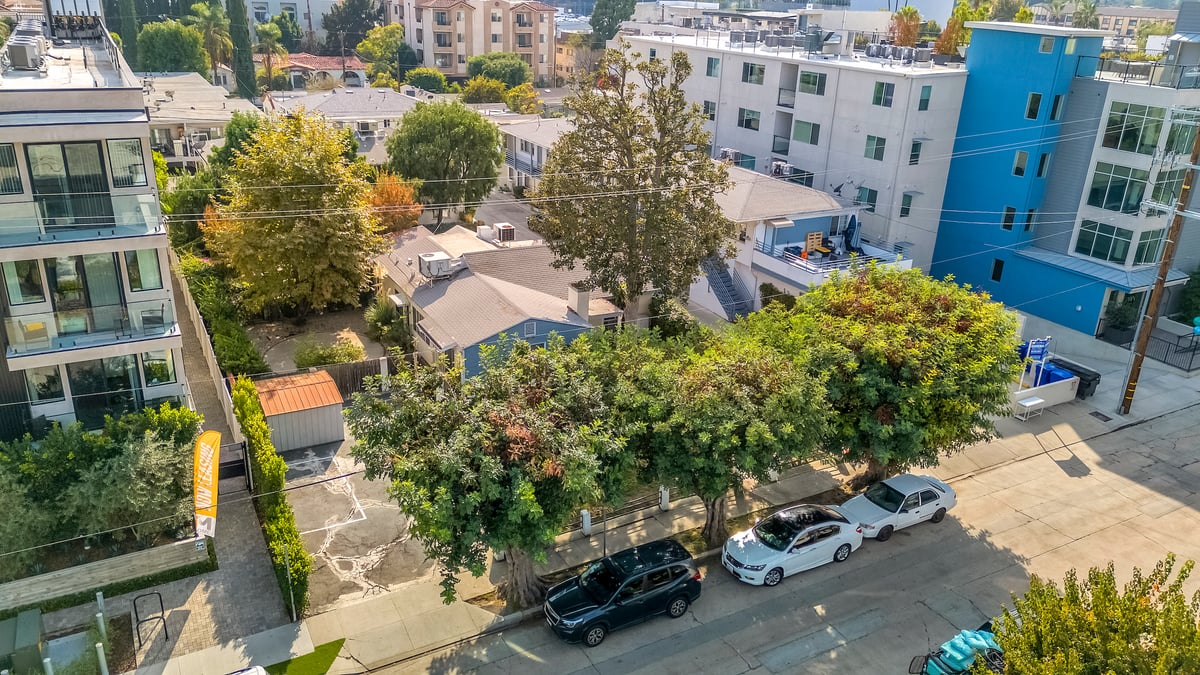
Hollywood and the Eastside neighborhoods form a dynamic multifamily corridor stretching from the entertainment epicenter of Hollywood Boulevard east through the hillside communities of Los Feliz, Silver Lake, and Echo Park, then into the rapidly evolving neighborhoods of Highland Park and Eagle Rock along the Metro Gold Line. Across 20 closed transactions totaling $48.3M in volume, the LAAA Team has documented a market defined by strong tenant demand, walkable neighborhoods, and significant value-add potential.
Hollywood leads this submarket with 7 transactions, followed by East Hollywood with 4. Properties along Hillhurst Avenue, Vermont Avenue, and Franklin Avenue benefit from walkable access to restaurants, bars, and the Griffith Observatory, commanding premium rents from young professionals and entertainment industry workers.
Hollywood proper, centered along Hollywood Boulevard, Sunset Boulevard, and Vine Street, is undergoing a generational transformation with new mixed-use and transit-oriented developments near the Hollywood/Highland and Hollywood/Vine Metro stations. The 7 deals closed in Hollywood reflect a market transitioning from legacy apartment buildings to a higher-density urban environment, with an average cap rate of 4.58% across the submarket's apartment sales.
The Eastside neighborhoods of Silver Lake, Echo Park, Atwater Village, and Highland Park represent some of LA's most sought-after urban living environments. Silver Lake's Sunset Junction area, Echo Park's proximity to Downtown via the 101, and Highland Park's revitalized York Boulevard corridor have attracted a creative-class tenant base willing to pay premium rents for neighborhood character and walkability.
Most buildings in Hollywood and the incorporated LA neighborhoods fall under the LA RSO for pre-1978 construction. Cap rates average 4.58% with a range from 2.12% to 6.38%. Average price per unit is $393,000, reflecting the strong location premiums that these walkable, amenity-rich neighborhoods command. Building stock is diverse, ranging from 1920s character buildings in Los Feliz to 1960s courtyard apartments in Hollywood to newer adaptive reuse projects in the Arts District-adjacent eastern neighborhoods.
Market Snapshot
Source: CoStar | Hollywood Multifamily | 2026 Q1Rents by Unit Type
Investment Activity (Trailing 12 Mo)
City Breakdown
Hollywood
7$18.64M volume
Avg cap: 4.48%
Avg $/unit: $463,125
View City →
East Hollywood
4$16.49M volume
Avg cap: 6.12%
Avg $/unit: $365,476
View City →
Hollywood Hills
2$3.41M volume
Avg cap: 5.52%
Avg $/unit: $345,625
Highland Park
2$2.50M volume
Avg cap: 3.11%
Avg $/unit: $500,000
Echo Park
2$2.40M volume
Avg cap: 2.12%
Avg $/unit: $341,667
Los Feliz
1$1.40M volume
Avg cap: 3.54%
Avg $/unit: $466,667
East Los Angeles
1$1.75M volume
Avg cap: 4.93%
Avg $/unit: $250,000
Silver Lake
1$1.69M volume
Avg cap: 5.52%
Avg $/unit: $280,833
Hollywood & Eastside Market Area
LAAA Team Closings in Hollywood & Eastside
20 transactions totaling $48.27M by Glen Scher, Filip Niculete & the LAAA Team
1431 N Vista St
Los Angeles • 2026
$1,600,000
1536 Serrano Ave
Los Angeles • 2026
$7,600,000Units
42Cap
6.38%$/Unit
$180,952
3662 Fredonia Dr
Los Angeles • 2026
$1,475,000Units
4Cap
5.52%$/Unit
$368,750
2900 Griffith Park Blvd
Los Angeles • 2023
$1,400,000Units
3Cap
3.54%$/Unit
$466,667
1001 Simmons Ave
Los Angeles • 2022
$1,750,000Units
7Cap
4.93%$/Unit
$250,000
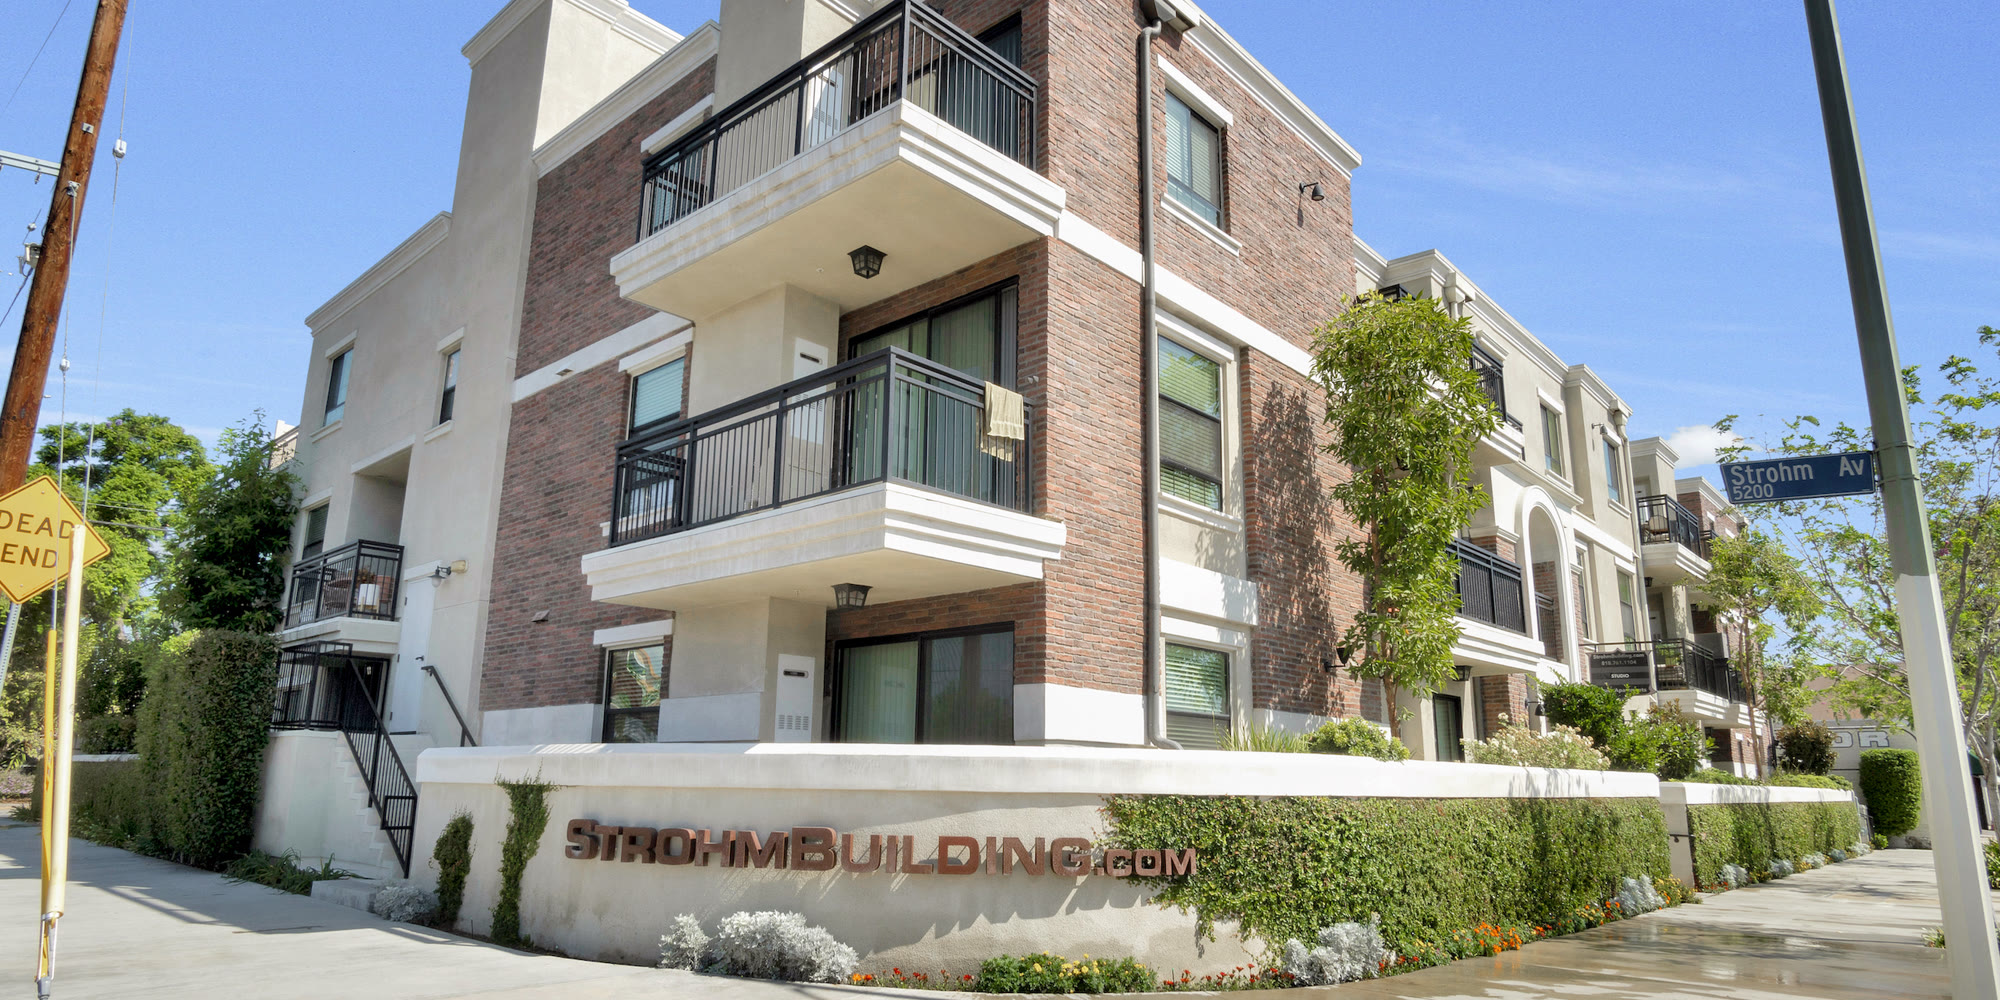
5330 Loma Linda Avenue
Los Angeles • 2021
$4,400,000Units
8Cap
5.86%$/Unit
$550,000
233-235 N Ave 55
Los Angeles • 2021
$1,000,000Units
2Cap
3.11%$/Unit
$500,000
6126 N Figueroa St
Los Angeles • 2021
$1,500,000Cap
1.81%
3415 Bellevue Ave
Los Angeles • 2021
$1,380,000Cap
5.88%
6914 De Longpre Ave
Los Angeles • 2021
$950,000
1350-1356 N Orange Dr
Los Angeles • 2021
$2,650,000
2649 N Beachwood Dr
Los Angeles • 2021
$1,935,000Units
6$/Unit
$322,500
1186 North New Hampshire Avenue
Los Angeles • 2020
$1,685,000Units
6Cap
5.52%$/Unit
$280,833
1438 Mariposa Ave
Los Angeles • 2019
$2,350,000
5016 W Sunset Blvd
Los Angeles • 2019
$2,137,500
6026 Barton Ave
Los Angeles • 2019
$1,385,000Units
4Cap
4.93%$/Unit
$346,250
716 Parkman Ave
Los Angeles • 2019
$1,025,000Units
3Cap
2.12%$/Unit
$341,667
1254-1260 N Citrus Ave
Los Angeles • 2019
$4,000,000Units
8Cap
3.61%$/Unit
$500,000
753 Lillian Way
Los Angeles • 2019
$5,500,000Units
8Cap
4.89%$/Unit
$687,500
1254-1256 Citrus Ave
Los Angeles • 2017
$2,550,000Units
8$/Unit
$318,750
Source: LAAA Team Closed Transactions
Recent Deal Stories

Our Active Listings in Hollywood & Eastside
Hollywood & Eastside Multifamily Investment FAQs
Also Explore
What's Your Hollywood & Eastside Apartment Building Worth?
Get a complimentary Broker Opinion of Value from the LAAA Team.