Glendale, Pasadena & Burbank Apartment Building Sales
Explore 48 closed transactions totaling $121.51M in the Glendale, Pasadena & Burbank market. Data from the LAAA Team at Marcus & Millichap.
Request Free Valuation48
Transactions
$121.51M
Total Volume
3.96%
Avg Cap Rate
$320,708
Avg $/Unit
7
Avg Units
2012
Since
Cap rate, price per unit and unit count are averaged across apartment sales only: 40 of these 48 closed transactions are apartment sales.
LAAA Team Track Record Since 2012
Glendale, Pasadena & Burbank Multifamily Market Overview
Glendale, Pasadena, and Burbank form a distinct multifamily investment corridor northeast of Downtown Los Angeles, anchored by three independent cities with their own regulatory environments. Across 48 closed transactions totaling $121.5M in volume, the LAAA Team has documented steady investor demand driven by entertainment industry employment, top-rated school districts, and walkable downtown cores.
Pasadena leads the submarket with 22 deals and $58.1M in sales volume. The areas along Colorado Boulevard, Lake Avenue, and Fair Oaks Avenue offer a mix of pre-war courtyard buildings and mid-century apartment complexes. South Pasadena, with its highly rated schools and charming downtown along Mission Street, commands premium pricing despite its small size. Pasadena adopted its own Rental Housing Fee and Tenant Protections ordinance effective February 2022, adding landlord obligations beyond AB 1482, including relocation assistance and just-cause eviction protections for buildings with 4+ units.
Glendale's Brand Boulevard corridor and surrounding residential neighborhoods contain a diverse apartment stock ranging from 1940s courtyard buildings to newer mid-rise construction. Glendale is an independent city not subject to the LA RSO, instead operating under AB 1482 statewide rent protections. The city's Armenian-American community, strong retail corridor, and proximity to the Glendale Galleria support consistent rental demand.
Burbank's proximity to Walt Disney Studios, Warner Bros., and NBCUniversal creates a unique employment-driven rental market. With 12 deals and an apartment average of $373,000 per unit (the highest in this submarket), Burbank's lower-density residential neighborhoods along Olive Avenue, Magnolia Boulevard, and near the Burbank Town Center attract tenants willing to pay premium rents for short commutes to entertainment jobs. Like Glendale, Burbank is independent of the LA RSO and operates under AB 1482.
Cap rates across the submarket's apartment sales average 3.96%, ranging from 1.92% to 8.64%. The range reflects the diversity of product types, from stabilized assets in South Pasadena to value-add opportunities in eastern Pasadena and Altadena. Average price per unit across the submarket's apartment sales is $321,000, with Burbank commanding a significant premium.
Market Snapshot
Source: CoStar | Glendale Pasadena Burbank Multifamily | 2026 Q1Rents by Unit Type
Investment Activity (Trailing 12 Mo)
City Breakdown
Pasadena
22$58.07M volume
Avg cap: 4.09%
Avg $/unit: $300,727
View City →
Burbank
12$36.08M volume
Avg cap: 4.26%
Avg $/unit: $372,731
View City →
Glendale
5$8.57M volume
Avg cap: 3.36%
Avg $/unit: $320,990
View City →
South Pasadena
3$6.65M volume
Avg cap: 3.54%
Avg $/unit: $369,167
View City →
Montrose
2$3.54M volume
Avg cap: 4.23%
Avg $/unit: $325,417
Monrovia
2$2.95M volume
Avg cap: 3.32%
Avg $/unit: $274,555
La Crescenta
1$2.55M volume
Avg cap: 2.62%
Avg $/unit: $283,333
Altadena
1$3.10M volume
Avg cap: 3.89%
Avg $/unit: $182,353
Glendale, Pasadena & Burbank Market Area
LAAA Team Closings in Glendale, Pasadena & Burbank
48 transactions totaling $121.51M by Glen Scher, Filip Niculete & the LAAA Team
2907 W Riverside Drive
Burbank • 2026
$1,590,000Units
4Cap
4.37%$/Unit
$397,500
4123 Ocean View Blvd
Montrose • 2026
$1,685,000Units
6Cap
4.94%$/Unit
$280,833
157 W Ash Ave
Burbank • 2023
$2,425,000Units
5Cap
5.06%$/Unit
$485,000
1027 Grover Ave
Glendale • 2023
$3,065,000Units
8Cap
4.40%$/Unit
$383,125
4318 W Victory Blvd
Burbank • 2023
$2,000,000Units
1Cap
4.94%$/Unit
$2,000,000
336, & 342 E Providencia Ave
Burbank • 2023
$7,050,000Units
24Cap
8.64%$/Unit
$293,750
328 E Providencia Ave
Burbank • 2023
$5,175,000Units
11Cap
4.06%$/Unit
$470,455
400 S Mentor Ave
Pasadena • 2023
$7,500,000Units
21Cap
4.41%$/Unit
$357,143
157 W Ash Ave
Burbank • 2022
$2,210,000Units
5Cap
3.81%$/Unit
$442,000
260 Linda Rosa Ave
Pasadena • 2021
$2,350,000Units
7Cap
4.06%$/Unit
$335,714
244 W Walnut Ave
Monrovia • 2021
$1,441,440Units
4Cap
3.12%$/Unit
$360,360
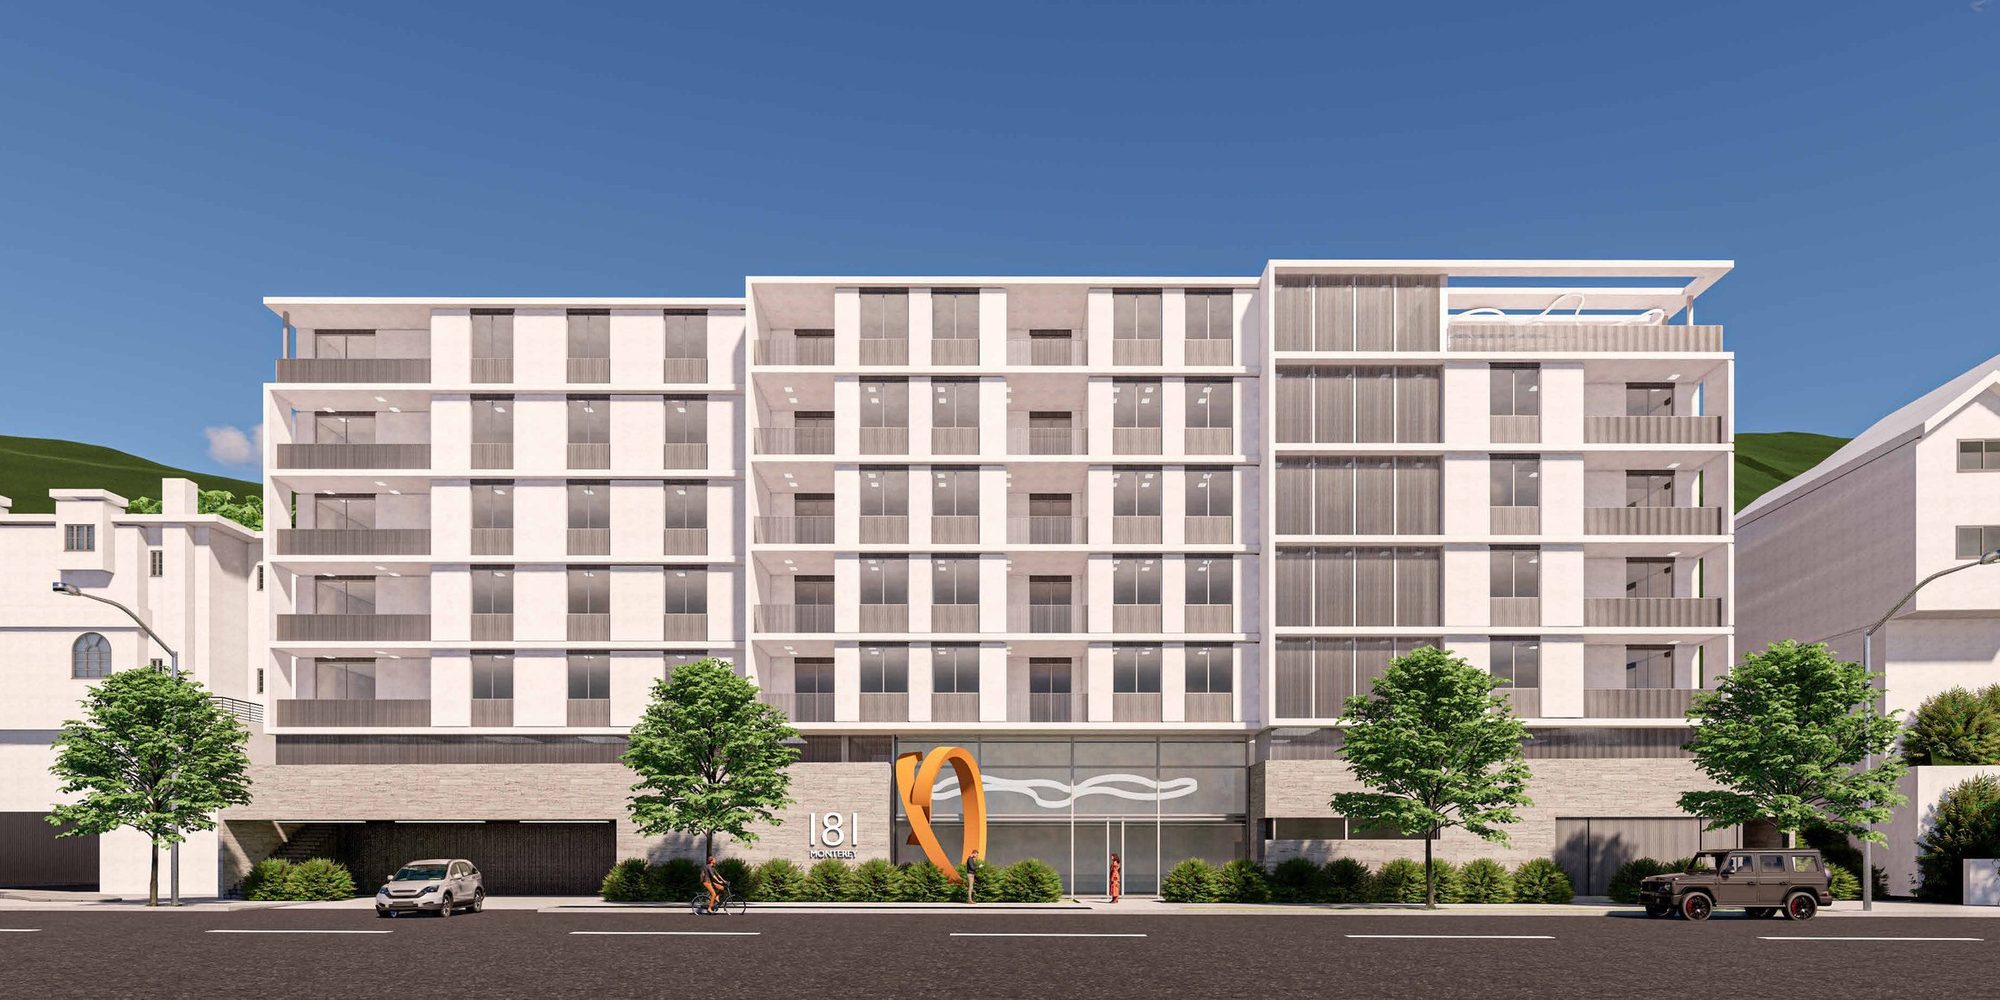
181 Monterey Rd
South Pasadena • 2021
$2,600,000
934 N Lake Ave
Pasadena • 2021
$1,433,000Units
6Cap
3.22%$/Unit
$238,833
2310 Montrose Ave
Montrose • 2020
$1,850,000Units
5Cap
3.52%$/Unit
$370,000
827 E Washington
Pasadena • 2020
$2,400,000Units
8Cap
5.79%$/Unit
$300,000
940 N Summit Ave
Pasadena • 2020
$1,225,000Units
3Cap
4.90%$/Unit
$408,333
130 S Euclid Ave
Pasadena • 2019
$4,575,000Cap
5.19%
106 N Allen Ave
Pasadena • 2019
$1,325,000Units
5Cap
5.33%$/Unit
$265,000
332 Pasadena Ave
South Pasadena • 2019
$1,900,000Units
5Cap
3.42%$/Unit
$380,000
913 Boston Ct
Pasadena • 2019
$1,600,000
Source: LAAA Team Closed Transactions
Recent Deal Stories
Our Active Listings in Glendale, Pasadena & Burbank
Glendale, Pasadena & Burbank Multifamily Investment FAQs
Also Explore
What's Your Glendale, Pasadena & Burbank Apartment Building Worth?
Get a complimentary Broker Opinion of Value from the LAAA Team.