Van Nuys Apartment Building Sales
Explore 43 closed transactions totaling $119.67M in Van Nuys. Data from the LAAA Team at Marcus & Millichap.
Request Free Valuation43
Transactions
$119.67M
Total Volume
4.91%
Avg Cap Rate
$247,752
Avg $/Unit
13
Avg Units
2012
Since
Cap rate, price per unit and unit count are averaged across apartment sales only: 39 of these 43 closed transactions are apartment sales. A sale with no figure recorded is left out of that average, so cap rate draws on 38.
LAAA Team Track Record Since 2012
Van Nuys Multifamily Market Overview
Van Nuys is the most active multifamily investment market in the entire Los Angeles metro area, anchoring the central San Fernando Valley along Van Nuys Boulevard, Sherman Way, and Victory Boulevard. Across 43 closed transactions totaling $119.7M in sales volume, the LAAA Team has documented an average price per unit of $248,000 across its 39 apartment sales, and an average cap rate of 4.91% across the 38 of those with a rate recorded.
The Van Nuys Boulevard commercial corridor from Roscoe Boulevard south to Victory Boulevard contains the densest concentration of apartment buildings in the Valley, with 1960s and 1970s garden-style complexes ranging from 8 to 40+ units. These buildings, predominantly Type V wood-frame construction with surface parking and courtyard layouts, represent the core of LA's workforce housing inventory. The Metro G Line (Orange Line) busway along Victory Boulevard and planned future rail conversion provide transit connectivity to North Hollywood's Metro B Line station and Warner Center.
Value-add strategies in Van Nuys center on interior renovations (kitchen, bath, flooring) to capture $200-$400 per month rent premiums, with renovation costs typically running $15,000-$25,000 per unit. Most Van Nuys apartment buildings fall under the LA RSO for pre-1978 construction. The neighborhood's combination of below-market rents, strong occupancy, and accessible pricing makes it the entry point of choice for first-time multifamily investors and experienced operators seeking scale in the Valley.
Market Snapshot
Source: CoStar | Van Nuys Multifamily | 2026 Q1Rents by Unit Type
Investment Activity (Trailing 12 Mo)
Van Nuys Market Area
LAAA Team Closings in Van Nuys
43 transactions by Glen Scher, Filip Niculete & the LAAA Team
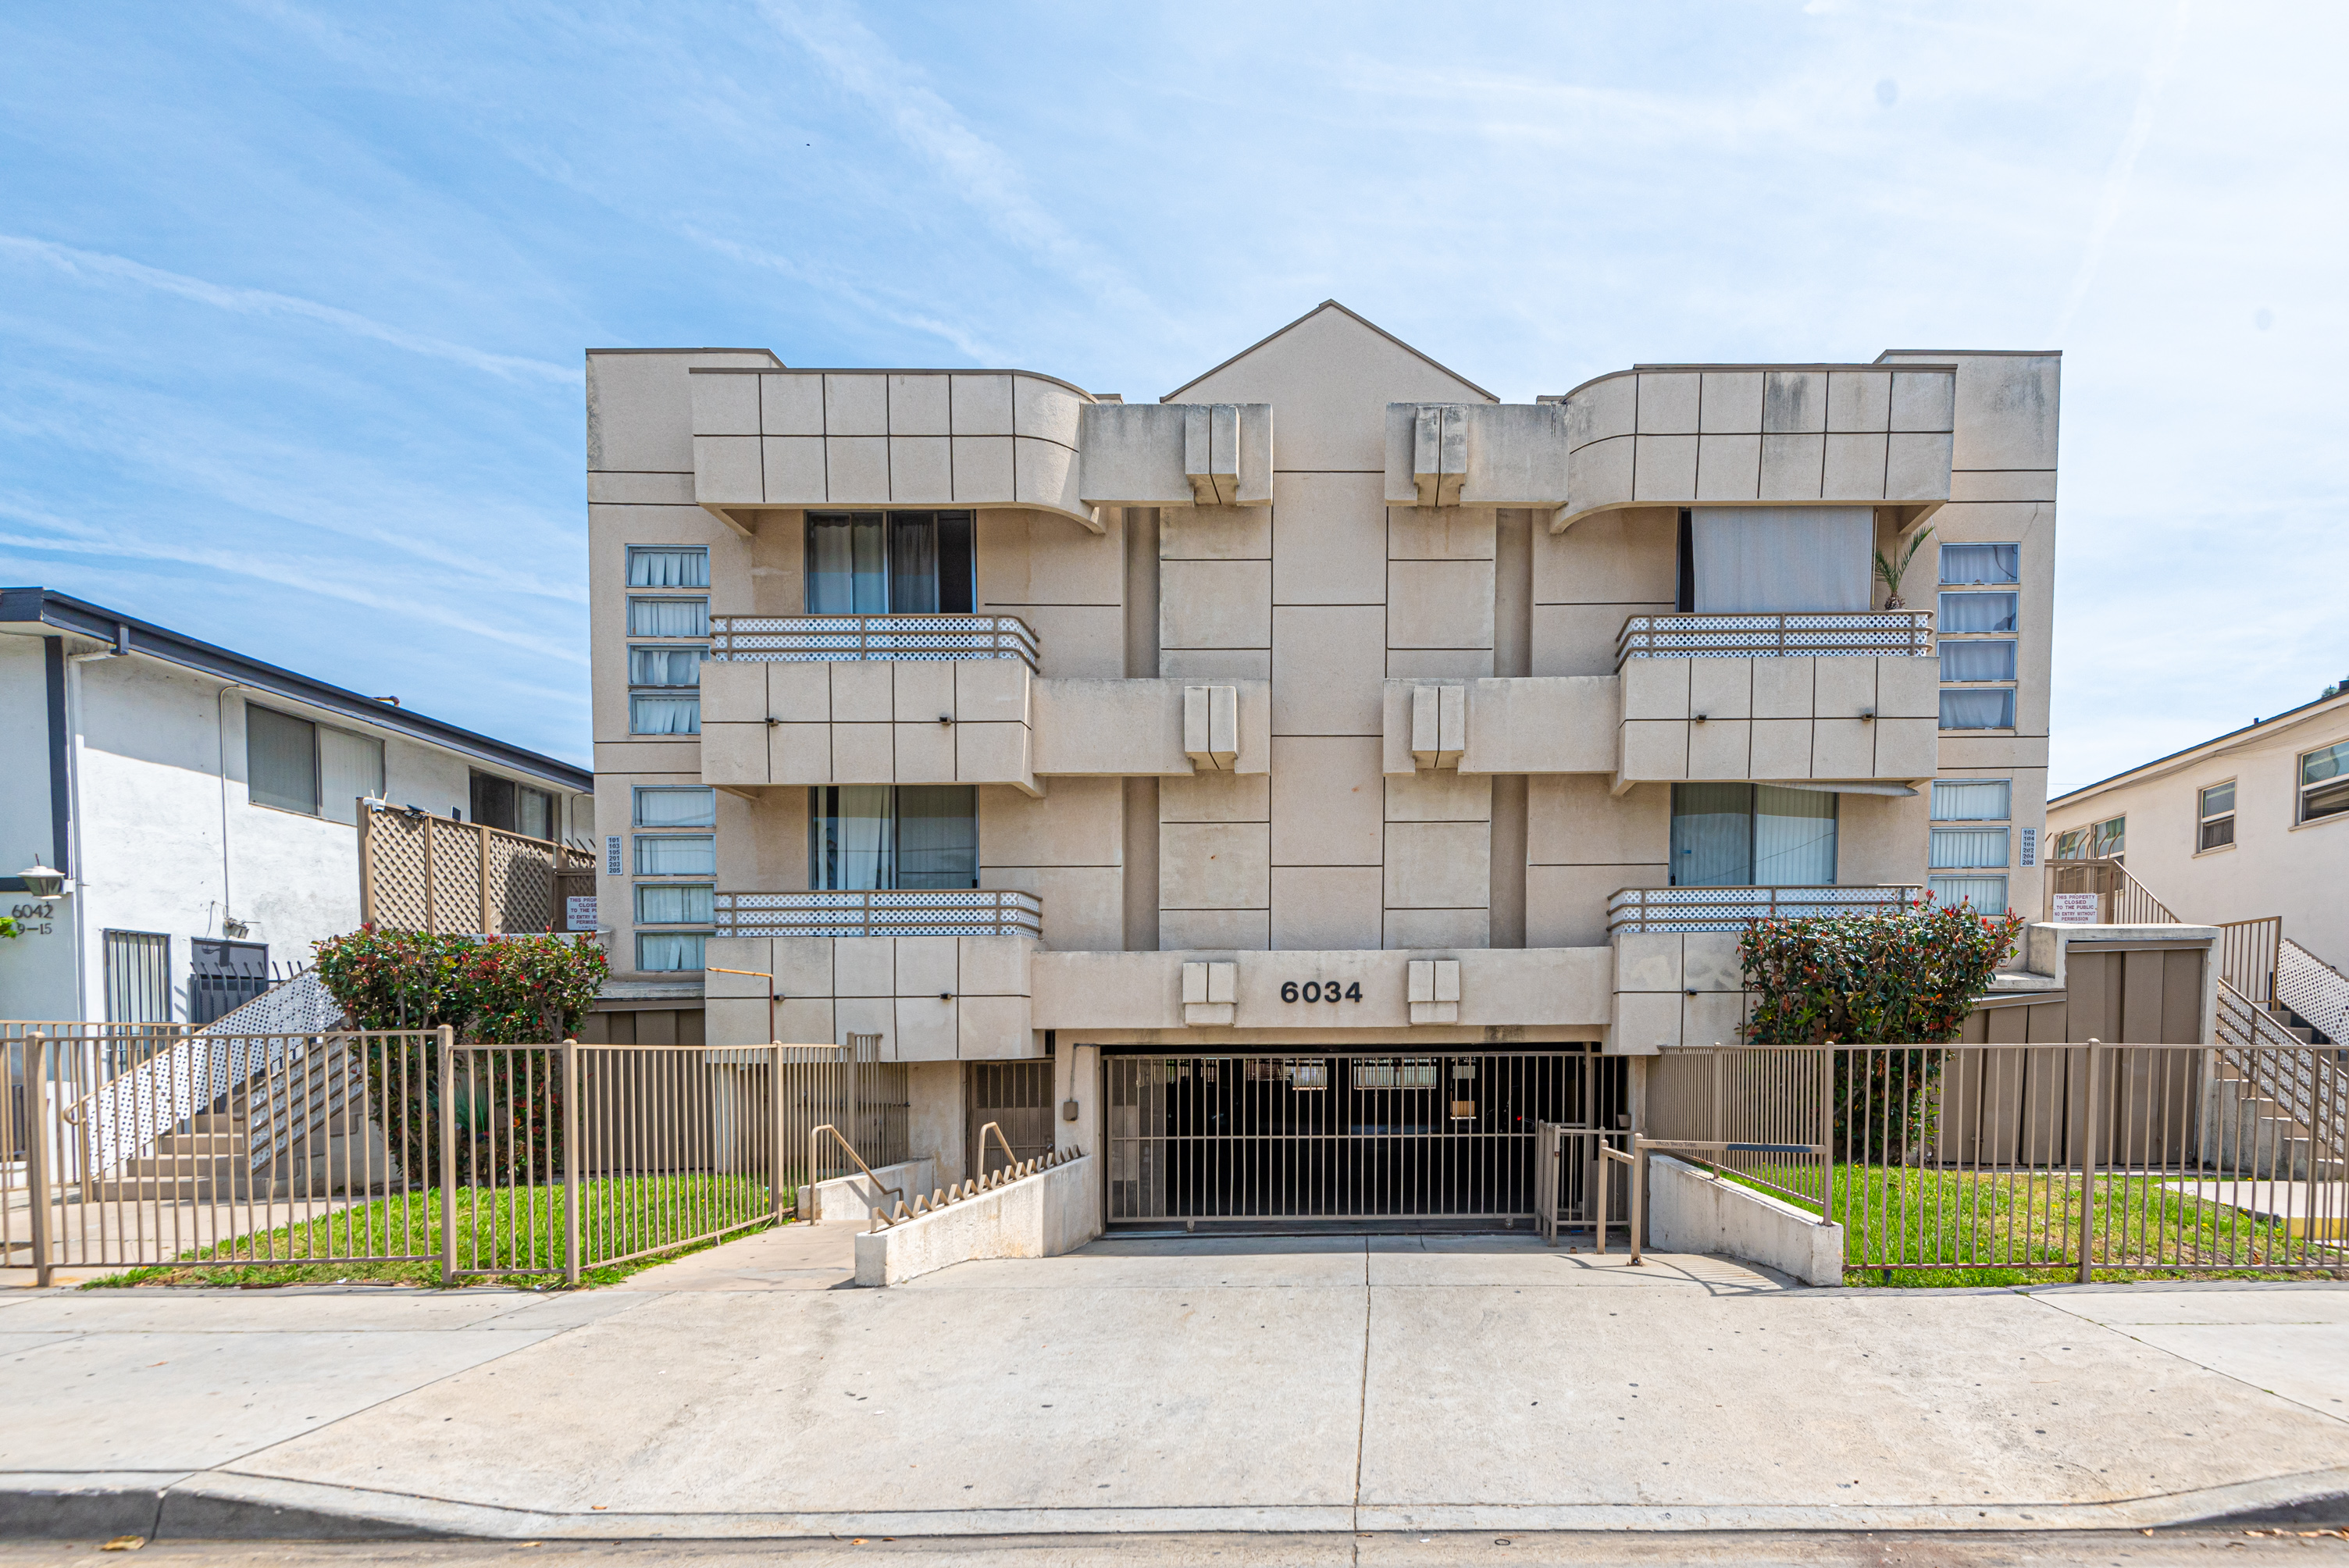
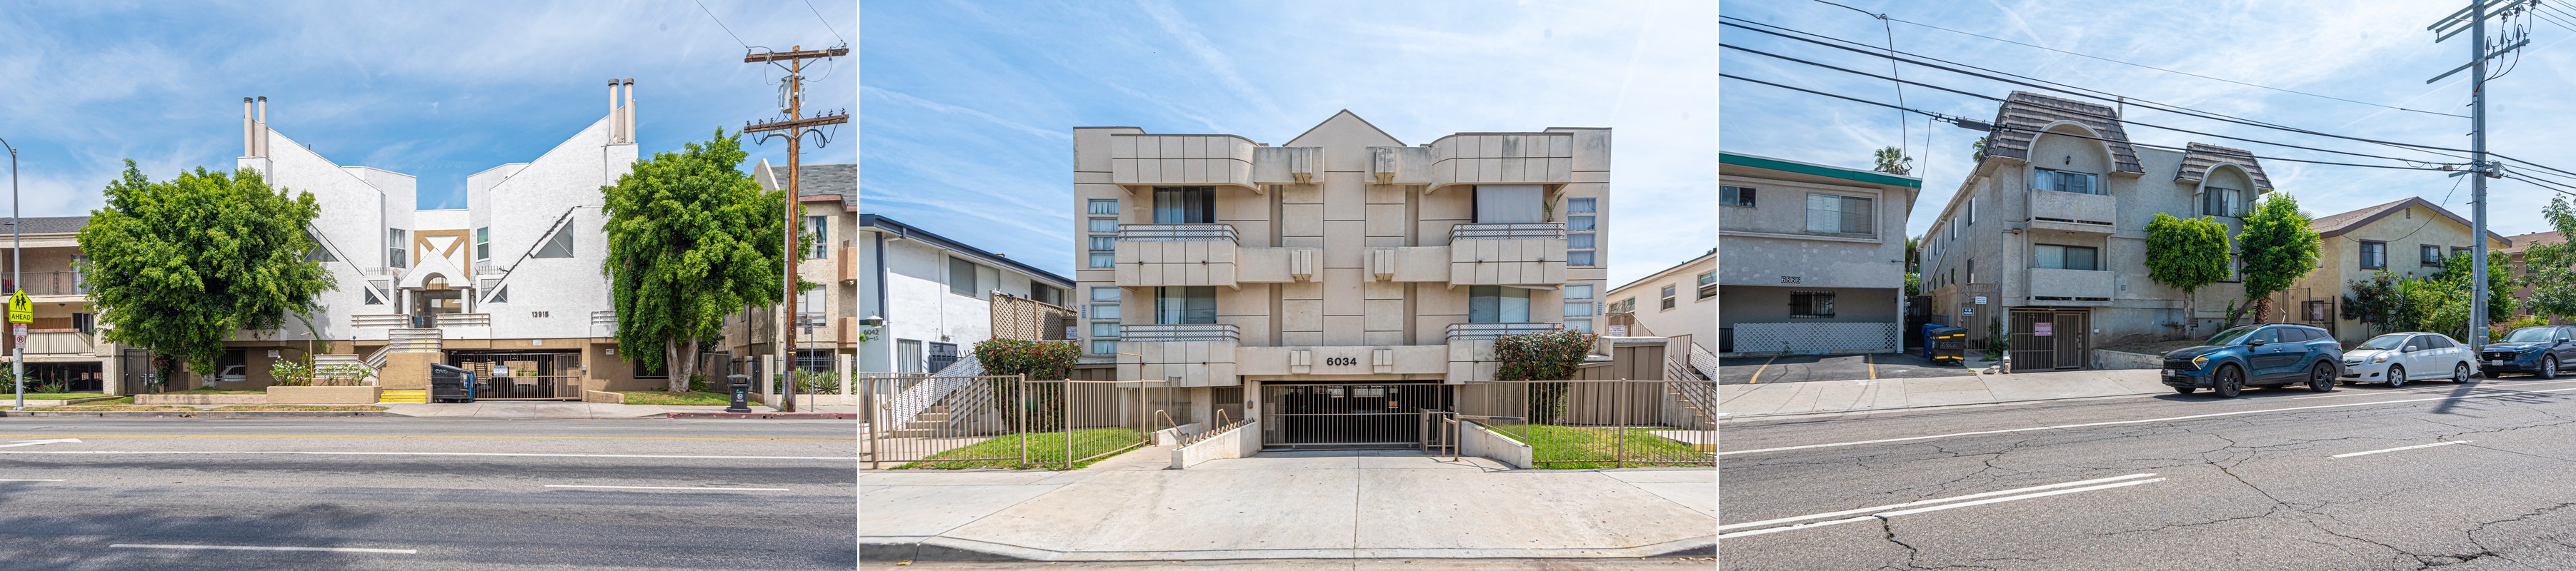
6034 Fulton Ave
Van Nuys • 2026
$2,910,000Units
12Cap
5.85%$/Unit
$242,500
14932 Kittridge St
Van Nuys • 2026
$1,734,000Units
4Cap
4.10%$/Unit
$433,500
5917 Buffalo Ave
Van Nuys • 2025
$1,645,000Units
5Cap
6.30%$/Unit
$329,000
14015 Oxnard St
Van Nuys • 2025
$5,136,000Units
32Cap
7.56%$/Unit
$160,500
6716 Sylmar Ave
Van Nuys • 2025
$3,500,000Units
12Cap
6.34%$/Unit
$291,667
14658 Gilmore St
Van Nuys • 2025
$1,690,000
6228 Fulton Ave
Van Nuys • 2024
$8,740,000Units
30Cap
6.05%$/Unit
$291,333
6311 Hazeltine Ave
Van Nuys • 2024
$915,000
7303 Woodley Ave
Van Nuys • 2024
$950,000Units
5Cap
5.44%$/Unit
$190,000
16647 Victory Blvd
Van Nuys • 2023
$1,075,000
5821 Hazeltine Ave
Van Nuys • 2022
$1,160,000Units
4Cap
4.33%$/Unit
$290,000
6727 Orion Ave
Van Nuys • 2022
$2,077,011Units
5Cap
4.03%$/Unit
$415,402
15716 Saticoy St
Van Nuys • 2021
$14,200,000Units
42Cap
4.35%$/Unit
$338,095
6616 Sylmar Ave
Van Nuys • 2021
$2,500,000Units
7Cap
4.19%$/Unit
$357,143
13210 Victory Blvd
Van Nuys • 2021
$5,635,000Units
30Cap
3.81%$/Unit
$187,833
14019 Vanowen St
Van Nuys • 2020
$2,690,000Units
5Cap
5.05%$/Unit
$538,000
14403-14409 Tiara St
Van Nuys • 2020
$5,450,000Units
8Cap
4.78%$/Unit
$681,250
14837 Delano St
Van Nuys • 2020
$1,762,500Units
8Cap
5.10%$/Unit
$220,313
6701 Woodley Ave
Van Nuys • 2019
$1,225,000
14154 Sylvan St
Van Nuys • 2019
$1,050,000Units
4Cap
4.95%$/Unit
$262,500
Source: LAAA Team Closed Transactions
Recent Deal Stories


Our Active Listings in Van Nuys
Van Nuys Multifamily Investment FAQs
What's Your Van Nuys Apartment Building Worth?
Get a complimentary Broker Opinion of Value from the LAAA Team.