Burbank Apartment Building Sales
Explore 13 closed transactions totaling $37.44M in Burbank. Data from the LAAA Team at Marcus & Millichap.
Request Free Valuation13
Transactions
$37.44M
Total Volume
3.88%
Avg Cap Rate
$372,731
Avg $/Unit
9
Avg Units
2012
Since
Cap rate, price per unit and unit count are averaged across apartment sales only: 10 of these 13 closed transactions are apartment sales.
LAAA Team Track Record Since 2012
Burbank Multifamily Market Overview
Burbank is the media capital of Los Angeles, where Walt Disney Studios, Warner Bros. Discovery, and Netflix's Burbank offices create a unique employment-driven rental market that commands some of the highest per-unit pricing in the Glendale-Pasadena-Burbank corridor. Across 13 closed transactions totaling $37.4M in volume, the LAAA Team has documented an average cap rate of 3.88% and an average price per unit of $372,731 across its 10 Burbank apartment sales.
The city's lower-density residential neighborhoods along Olive Avenue, Magnolia Boulevard, and in the blocks surrounding the Burbank Town Center attract entertainment industry professionals willing to pay premium rents for short commutes to studio lots. Unlike the LA city RSO, Burbank operates as an independent city subject to AB 1482 statewide rent protections, which many investors view as a more favorable regulatory environment.
Burbank's apartment stock tends toward smaller, lower-density buildings of 4-16 units on quiet residential streets, reflecting the city's strict zoning that limits new construction density. This supply constraint, combined with entertainment industry employment growth, has driven per-unit pricing to levels that rival Santa Monica and West LA. The Burbank Airport, Metrolink station, and proximity to the 5 and 134 freeways add transportation convenience that broadens the tenant pool.
Market Snapshot
Source: CoStar | Burbank Multifamily | 2026 Q1Rents by Unit Type
Investment Activity (Trailing 12 Mo)
Burbank Market Area
LAAA Team Closings in Burbank
13 transactions by Glen Scher, Filip Niculete & the LAAA Team
4306-4310 W Victory Blvd
Burbank • 2026
$1,360,000Units
3$/Unit
$453,333
2907 W Riverside Drive
Burbank • 2026
$1,590,000Units
4Cap
4.37%$/Unit
$397,500
157 W Ash Ave
Burbank • 2023
$2,425,000Units
5Cap
4.78%$/Unit
$485,000
4318 W Victory Blvd
Burbank • 2023
$2,000,000Units
1Cap
4.90%$/Unit
$2,000,000
336-342 E Providencia Ave
Burbank • 2023
$7,050,000Units
24Cap
4.93%$/Unit
$293,750
328 E Providencia Ave
Burbank • 2023
$5,175,000Units
11Cap
4.48%$/Unit
$470,455
157 W Ash Ave
Burbank • 2022
$2,210,000Units
5Cap
3.58%$/Unit
$442,000
401 S Flower St
Burbank • 2018
$1,600,000Cap
4.00%
1213 North Screenland Drive
Burbank • 2017
$1,800,000Units
6Cap
3.01%$/Unit
$300,000
143 N Maple St
Burbank • 2017
$1,475,000Units
4Cap
3.54%$/Unit
$368,750
703 East Providencia Avenue
Burbank • 2016
$1,970,000Units
10Cap
3.00%$/Unit
$197,000
422 South Lake Street
Burbank • 2016
$7,250,000Units
14Cap
3.13%$/Unit
$517,857
2501 North Glenoaks Boulevard
Burbank • 2015
$1,530,000Units
6Cap
3.99%$/Unit
$255,000
Source: LAAA Team Closed Transactions
Recent Deal Stories
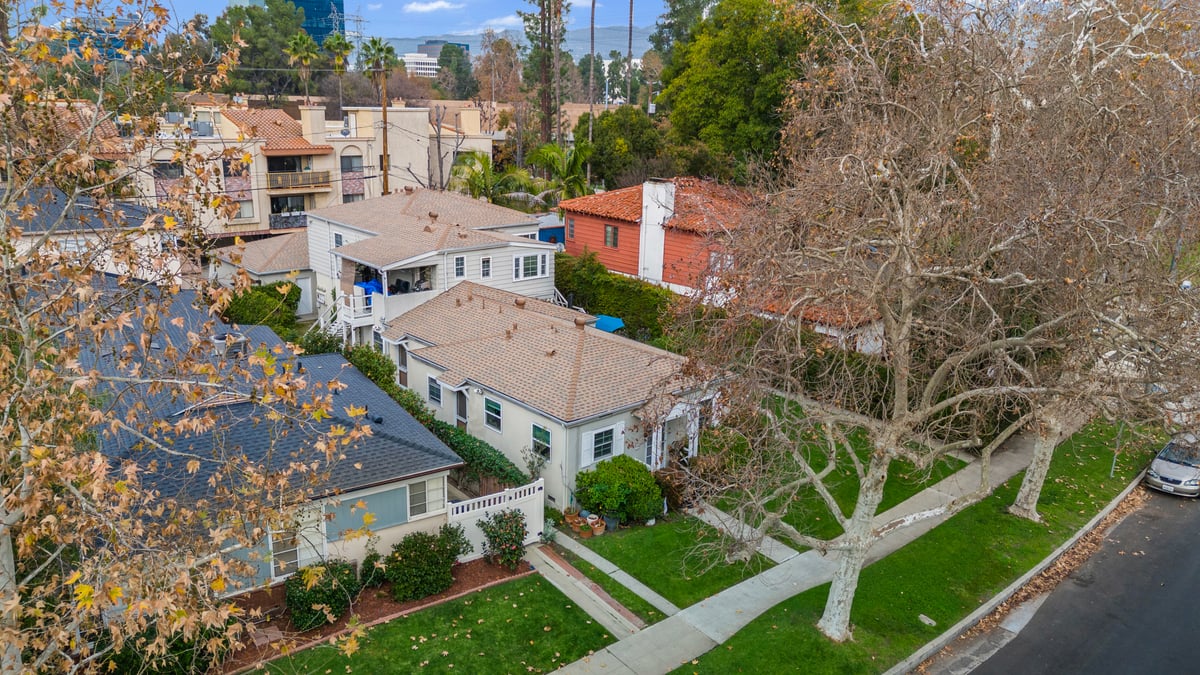


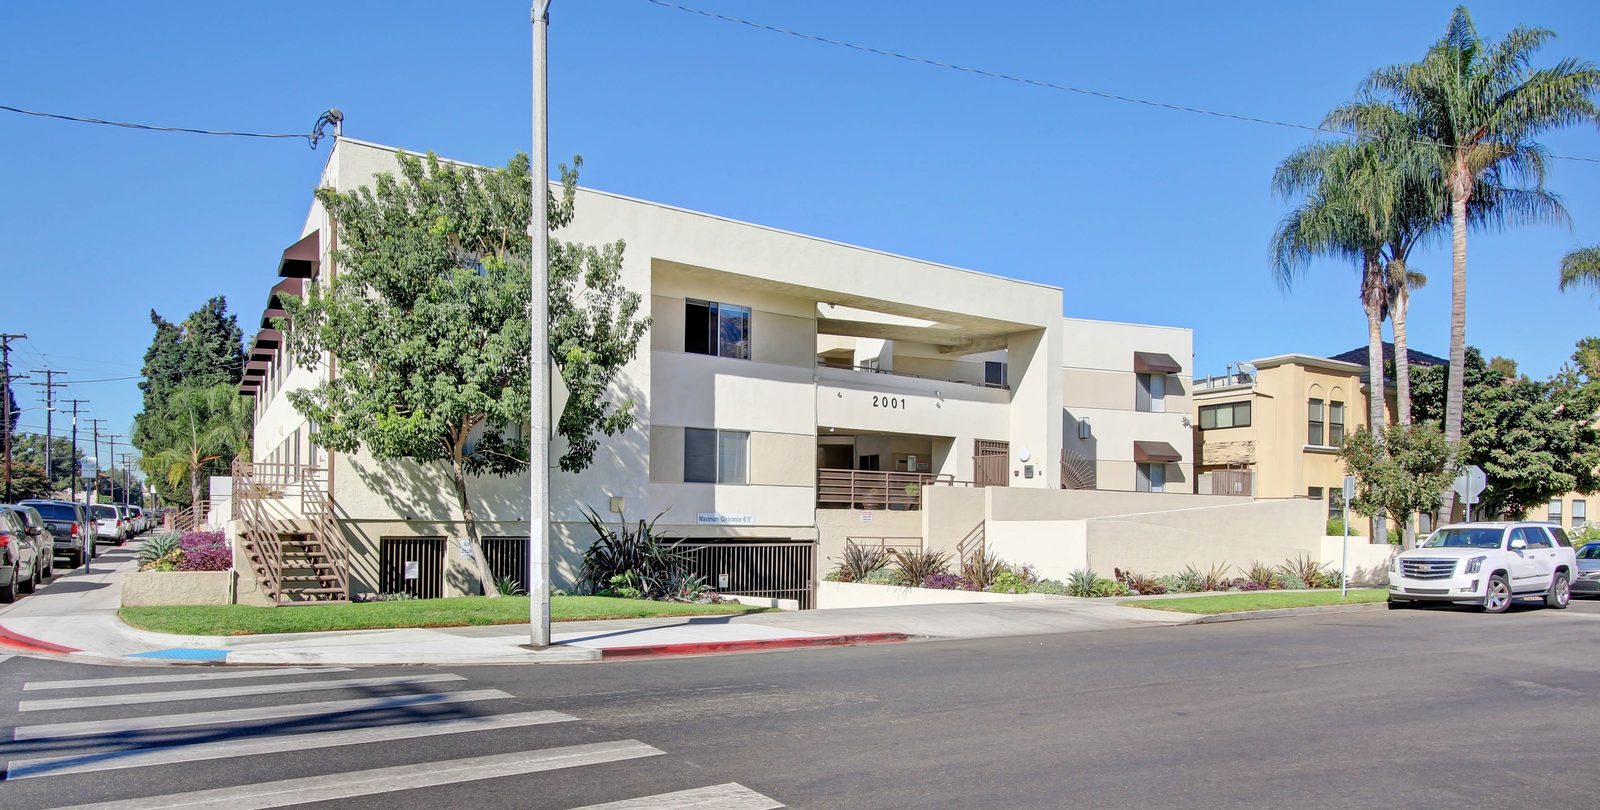
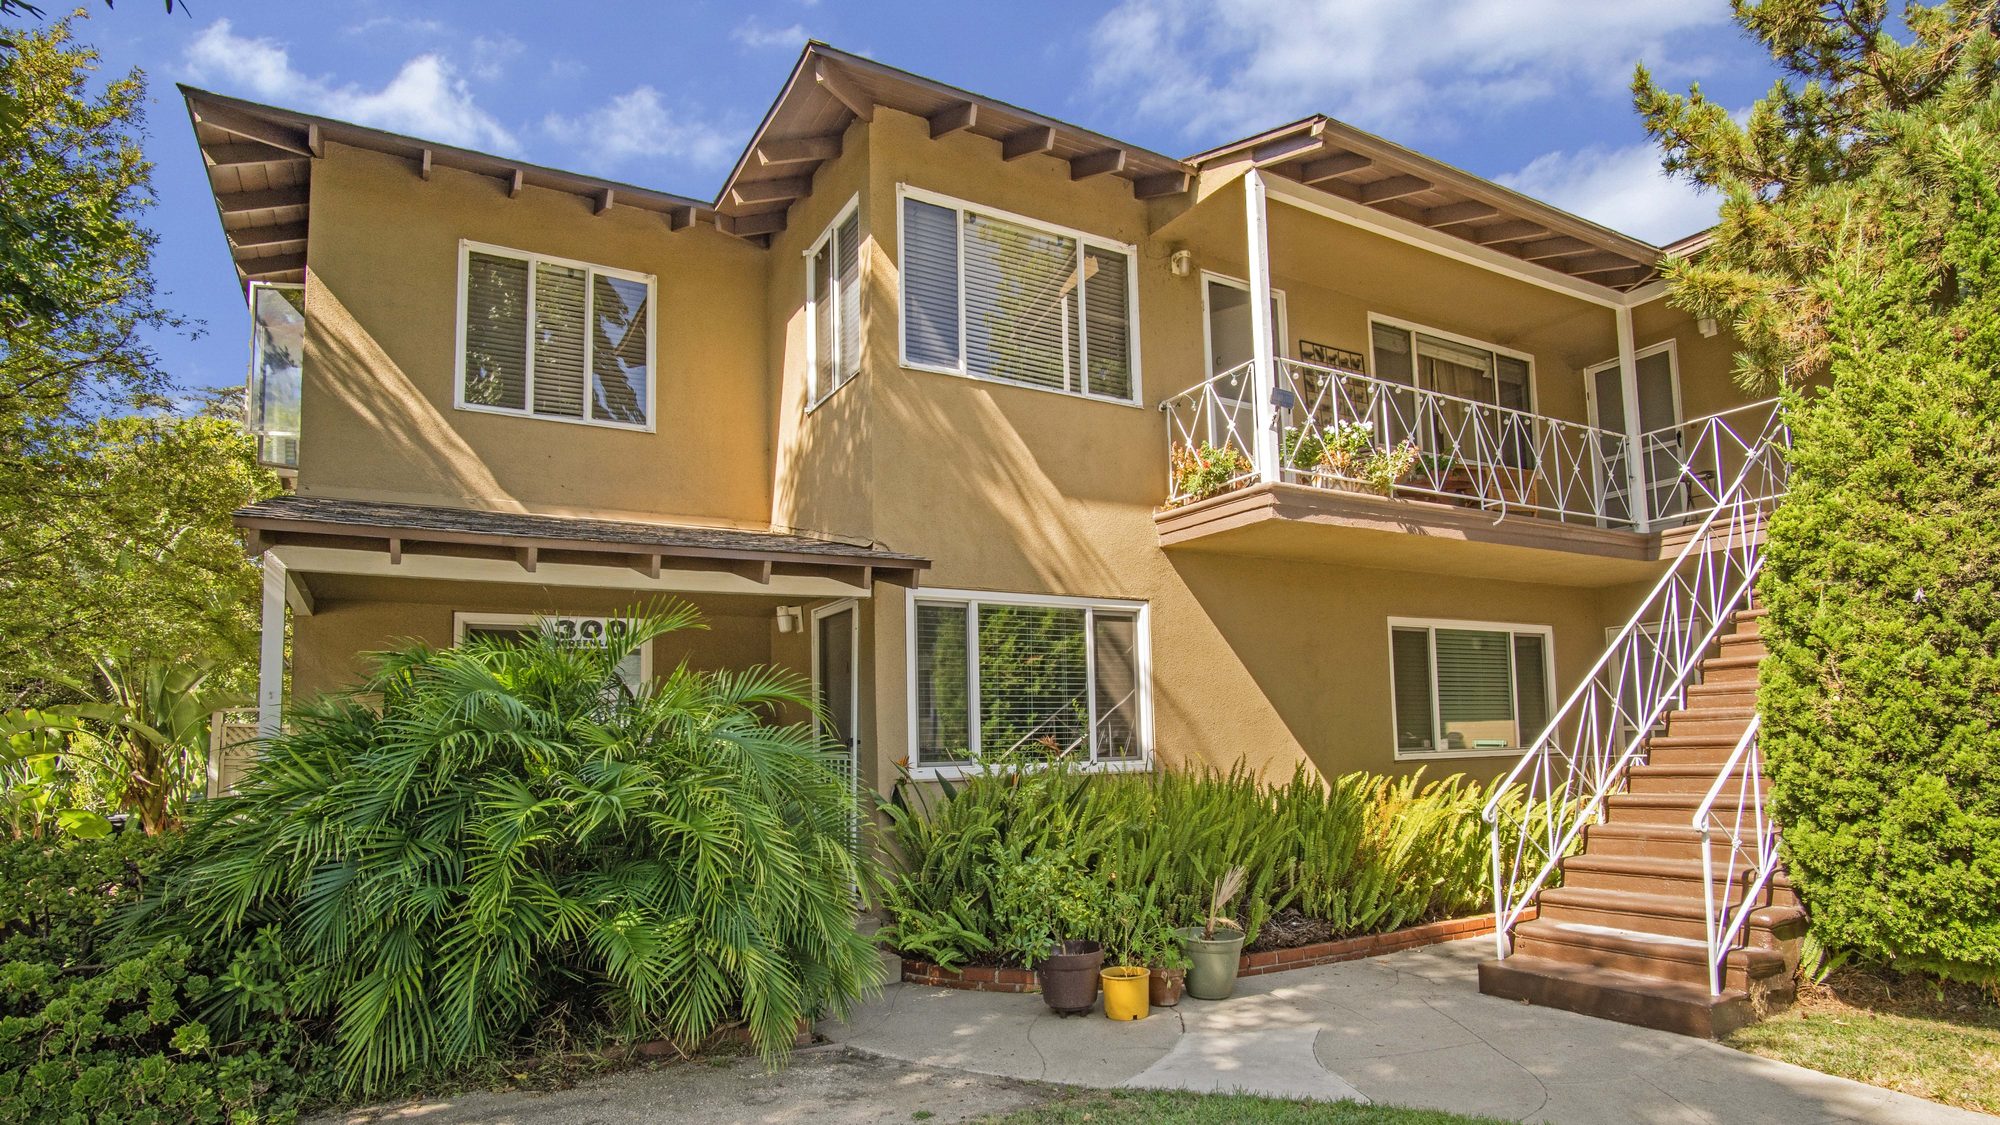
Our Active Listings in Burbank
Burbank Multifamily Investment FAQs
Burbank apartment buildings average approximately $372,731 per unit across the LAAA Team's 10 apartment sales in the city, part of 13 closed transactions totaling $37.4M in volume. This is among the highest average per-unit pricing in the GPB corridor, driven by entertainment studio proximity (Disney, Warner Bros., Netflix) and limited new apartment construction in Burbank's lower-density zoning framework.
Cap rates in Burbank average 3.88% across 10 closed apartment deals with a recorded cap rate. Yields sit close to Santa Monica's (3.98%), and the premium per-unit pricing reflects Burbank's unique entertainment employment demand and the supply constraints imposed by the city's lower-density residential zoning.
Burbank is an independent city not subject to the Los Angeles RSO. Instead, Burbank operates under AB 1482 statewide rent protections, which cap annual increases at 5% plus CPI (max 10%) for buildings 15+ years old and require just cause for eviction. This regulatory environment is generally considered more investor-friendly than areas subject to the LA RSO.
What's Your Burbank Apartment Building Worth?
Get a complimentary Broker Opinion of Value from the LAAA Team.